


Published on Mar 23, 2026

Super Admin
Best APM Platforms for Engineering Teams in 2026
What DevOps Teams Need to Know Before Committing
For DevOps and SRE teams, an APM tool isn't something you evaluate once and forget. It's the system you live in during incidents, the thing that pages you at 3am, and the dashboard your team stares at during deploys. The feature matrix matters less than how the tool behaves under pressure - how fast it surfaces the root cause, how reliably it alerts without false positives, and how much operational overhead it adds to your already full plate.
The APM market in 2026 has enough credible options that no single platform is the obvious default. The differences that matter most for day-to-day operations - alerting quality, query speed, deployment integration, and incident response workflows - are harder to evaluate from a marketing page than feature counts and pricing tables. This guide covers seven platforms from the perspective of the teams that actually operate them.
How We Estimated Costs
Reference scenario: 30TB/month ingestion (~20TB logs, 7TB traces, 3TB metrics)
Infrastructure: 100 hosts, 20 full-platform users, 500K active metric series
Retention: 30 days across all signal types; 30% of logs indexed
Scope: Core observability only - no security, profiling, or synthetics
Note: these are directional estimates based on public rate cards, early 2026.
Vendor discounts and committed-use agreements can materially reduce SaaS costs.
What Actually Matters When You're On-Call
- Alerting quality - false positive rate matters more than alert configuration flexibility. A tool that pages you five times a night for non-issues is worse than one with fewer knobs but better signal.
- Query speed at scale - when you're debugging a production incident, a dashboard that takes 30 seconds to load is not acceptable. Query performance at 30TB/month varies dramatically between tools.
- Deployment tracking - correlating performance regressions with specific deploys is the single most useful APM capability during incident response.
- Predictable billing - operational teams shouldn't have to worry about whether investigating an incident will blow the observability budget. Multi-dimensional billing creates perverse incentives to log less.
- Instrumentation overhead - agents and collectors consume resources. Proprietary agents that require separate upgrades add operational burden. OpenTelemetry-native tools simplify the instrumentation layer.
- Support response during incidents - when your APM tool itself has an issue during an outage, response time from the vendor matters enormously.
1. CubeAPM
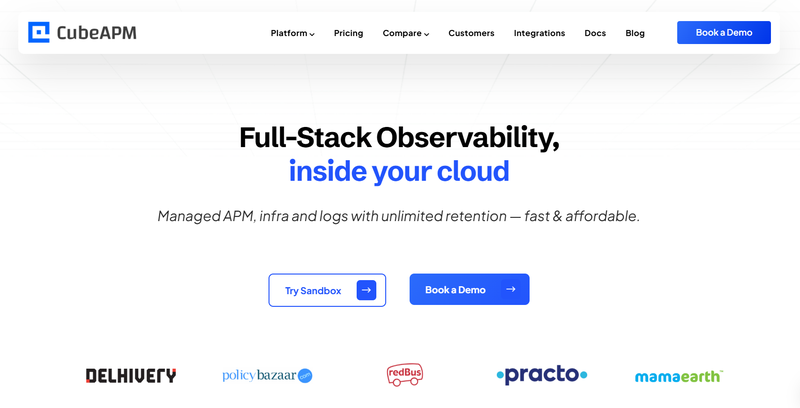
Best for: DevOps teams that want full-stack observability without the operational overhead of managing billing complexity or worrying about data egress
Overview
CubeAPM is a self-hosted, OpenTelemetry-native observability platform covering APM, logs, infrastructure, Kubernetes, RUM, synthetic monitoring, Kafka monitoring, and error tracking. It runs inside your cloud or on-prem, so there's no data egress and no external dependency during incidents - your monitoring stays up even if the internet doesn't.
Recognized as a High Performer in G2's Spring 2026 APM Grid Report. Used by redBus, Delhivery, Mamaearth, Policybazaar, Practo, and others across diverse operational environments.
Operational Highlights
- Full-stack unified monitoring - APM, logs, infrastructure, Kubernetes, Kafka, RUM, synthetic monitoring, error tracking - all in one system, one query interface
- OpenTelemetry-native - no proprietary agents to upgrade and manage; works with existing Prometheus, Datadog, and New Relic agents for gradual migration
- Self-hosted - monitoring is not dependent on an external SaaS provider. During an outage, your observability stack is on your infrastructure, not someone else's.
- Data Compliance: CubeAPM’s self-hosted architecture ensures full data residency control by design, while SOC 2 and ISO 27001 certification demonstrate adherence to industry-recognized security and governance standards.
- AI-based trace sampling - intelligently retains traces that matter, reducing storage without blind spots
- Direct engineering support via shared channels - when you need help during an incident, you get an engineer, not a ticket queue
Pricing
$0.15/GB flat. No per-host, per-seat, or custom metrics fees.
At 30TB/month: ~$5,100/month all-in
$4,500/month license + ~$600/month infrastructure. redBus reported 4x faster dashboards and 50% faster MTTR. Delhivery documented 75% cost reduction. Mamaearth migrated in under an hour with zero downtime.
Pros
- Consistently 70–75% lower cost than enterprise APM at scale
- No billing anxiety - single dimension pricing means investigating incidents never costs extra
- Self-hosted means monitoring stays up during external connectivity issues
- Multi-agent compatible - migrate incrementally without re-instrumenting anything
- Engineering-level support responds in minutes during incidents
Cons
- Requires BYOC or on-prem deployment - your team manages the infrastructure
- No autonomous anomaly detection (AI trace sampling is not full AIOps alerting)
- SSO/RBAC less mature than enterprise SaaS incumbents
2. Datadog
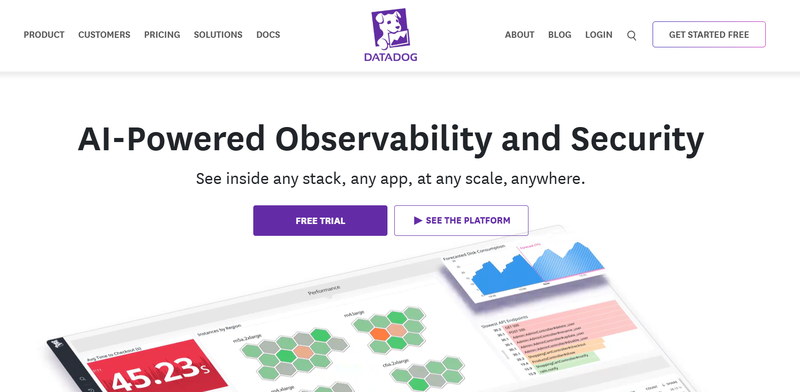
Best for: Cloud-native DevOps teams that need deep CI/CD integration and the broadest possible ecosystem of pre-built dashboards and monitors
Overview
Datadog is the category leader with 700+ integrations and the most polished operational UI in the market. Deployment tracking, service maps, and Watchdog AI for anomaly detection make it a strong choice for teams that live in their APM tool during incidents. The trade-off is billing complexity that can create friction between operations and finance.
Operational Highlights
- Unified observability: metrics, logs, APM, RUM, synthetics, security, database monitoring
- 700+ integrations - most pre-built dashboards for common infrastructure
- Watchdog AI proactively surfaces anomalies and reduces alert noise
- Strong deployment tracking and CI/CD correlation
- Service maps and dependency visualization
Pricing
Multi-dimensional: hosts + custom metrics + log ingestion ($0.10/GB) + log indexing (~$2.50/million events at 30 days) + APM spans + RUM sessions. Custom metrics can constitute 30-52% of the bill at scale.
At 30TB/month: ~$30,000-$45,000+/month
Third-party calculators exist for modeling Datadog bills - use them before committing to an annual contract.
Pros
- Best-in-class integration ecosystem and operational UI
- Watchdog AI reduces alert fatigue - important for on-call teams
- Tight deploy-to-performance correlation out of the box
- Strong CI/CD and security visibility
Cons
- Billing complexity creates incentive to log less and query less - bad for incident response culture
- OTel metrics often billed as custom metrics at premium rates
- No self-hosted option; monitoring depends on Datadog's SaaS availability (for teams that need monitoring independence from external services, self-hosted platforms like CubeAPM are worth evaluating)
- Retention is limited on standard tiers
3. Dynatrace
Best for: Large enterprise operations teams that need automated root cause analysis to reduce MTTR in complex environments
Overview
Dynatrace's Davis AI performs causal root cause analysis - not just anomaly detection, but automated correlation of topology, dependencies, and performance data to identify the actual cause. For ops teams managing complex microservice architectures, this can significantly reduce the time between alert and resolution.
Operational Highlights
- Davis AI: causal root cause analysis - tells you why, not just what
- Automatic service discovery and full dependency mapping via Smartscape
- Full-stack monitoring: applications, infrastructure, Kubernetes, cloud services
- Dynatrace Managed: self-hosted option for teams that need monitoring independence
- OneAgent automates instrumentation - less manual configuration for ops teams
Pricing
Consumption-based DPS with annual minimum (~$2,000/month minimum). $0.08/hour per 8 GiB host, log ingest $0.20/GiB. 4 GiB minimum billing for small hosts.
At 30TB/month: ~$20,000-$35,000+/month
Pros
- Best automated root cause analysis - genuinely reduces MTTR for complex architectures
- Automatic topology discovery means less manual configuration
- Dynatrace Managed keeps monitoring on your infrastructure
- Strong compliance and enterprise security features
Cons
- Davis AI needs a baselining period - new deployments or architectures don't get full value immediately
- Mandatory annual commitment locks in spend
- OneAgent is proprietary - adds an agent to manage that isn't OTel-standard
- 4 GiB minimum billing penalizes container-heavy architectures
4. New Relic
Best for: Smaller DevOps teams that want a broad platform without upfront commitment and value flexible querying for incident investigation
Overview
New Relic's NRDB unified telemetry store and NRQL query language make ad-hoc incident investigation fast and flexible. The free tier (100GB/month + 1 user) lets small teams get started without procurement overhead.
Operational Highlights
- NRDB: unified telemetry - metrics, events, logs, traces queryable from one interface
- NRQL: SQL-like querying that makes ad-hoc analysis during incidents accessible to any engineer
- Distributed tracing, service maps, browser and mobile monitoring
- Free tier: 100 GB/month + 1 full platform user
- Compute-based pricing option for teams that want to avoid per-seat costs
Pricing
Data ingest ($0.40/GB standard, $0.60/GB Data Plus for 90-day retention) + user fees ($49-$349/user/month).
At 30TB/month: ~$20,000-$25,000+/month
Pros
- NRQL is one of the best ad-hoc analysis tools for incident investigation
- 100 GB/month free tier - easiest way to get started
- Unified telemetry store means no context-switching between tools
- Compute-based pricing option available
Cons
- Per-user fees mean adding a team member to help with an incident has a cost
- 8-day default retention - fine for real-time ops, limiting for postmortems
- No self-hosted option
- Cost surprises from enabling new telemetry types during incident investigation
5. Grafana Cloud (LGTM Stack)
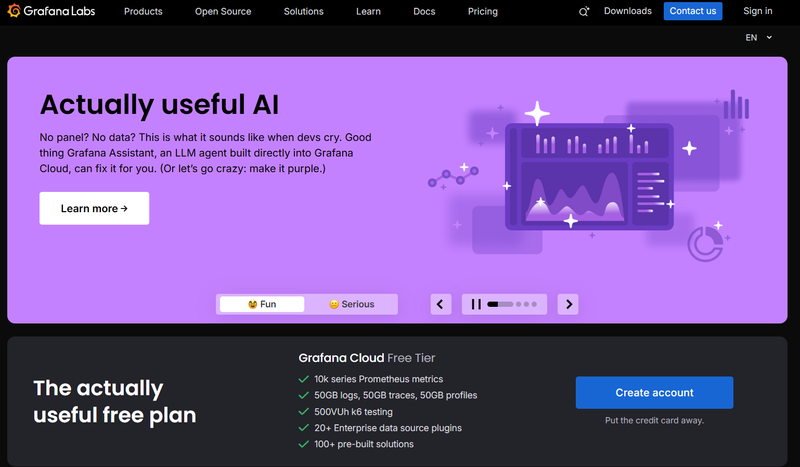
Best for: SRE teams comfortable with open-source tooling that want maximum customization and dashboard flexibility
Overview
Grafana is the dashboarding standard for many DevOps teams. Grafana Cloud bundles Loki (logs), Tempo (traces), and Mimir (metrics) into a managed stack. For teams already using Grafana for visualization, adding the full LGTM stack is a natural extension. The OTel-native architecture means no custom metrics penalty - a practical advantage for teams that don't want to worry about metric classification.
Operational Highlights
- LGTM stack: Loki, Grafana, Tempo, Mimir
- Full OTel native support - no custom metrics penalty, no proprietary agents
- Adaptive Metrics and Adaptive Logs to reduce noise and billing
- Self-hosted (free) or Grafana Cloud (managed)
- Highly customizable dashboards - the most flexible visualization in this list
Pricing
$19/month base + usage. Logs ~$0.55/GB effective. Traces $0.50/GB. Metrics $8/1,000 series. Enterprise: $25K/year minimum.
At 30TB/month (managed): ~$15,000-$20,000+/month
Pros
- Most customizable dashboarding - teams can build exactly the views they need for on-call
- OTel-native; no agent management overhead beyond the collector
- Adaptive Metrics/Logs reduce noise proactively
- Self-hosted option for teams that want full control
Cons
- Self-hosting at 30TB scale is a significant SRE commitment in itself
- APM experience is less mature than purpose-built tools - more assembly required
- No built-in AI/ML anomaly detection - relies on community plugins or manual rules
- Managed cloud costs approach enterprise SaaS at high log volumes
6. Elastic APM
Best for: Teams already running ELK for log management who want traces and APM in the same query interface without adding another tool
Overview
Elastic APM adds distributed tracing to the Elastic Stack. For ops teams already troubleshooting in Kibana, adding APM data to the same cluster means no context-switching - logs and traces are queryable together natively.
Operational Highlights
- APM data lives in Elasticsearch alongside logs - single search interface for incidents
- OpenTelemetry compatible (OTel collector to Elasticsearch)
- ML-based anomaly detection via Elastic ML
- Self-hosted (free) or Elastic Cloud
- Service maps and distributed tracing
Pricing
Self-hosted is free; Elastic Cloud is deployment-based.
At 30TB/month (Elastic Cloud): ~$8,000-$15,000/month
Pros
- Zero incremental cost for existing ELK deployments
- Unified log + trace investigation in one Kibana interface
- Self-hosted keeps data on your infrastructure
- ML anomaly detection included
Cons
- Running Elasticsearch at 30TB is a full-time operational commitment
- APM UX is less polished than Datadog, Dynatrace, or purpose-built tools
- SSPL licensing (2021) - review for compliance before self-hosting
- Self-hosted support limited to paid subscriptions
7. Splunk Observability Cloud
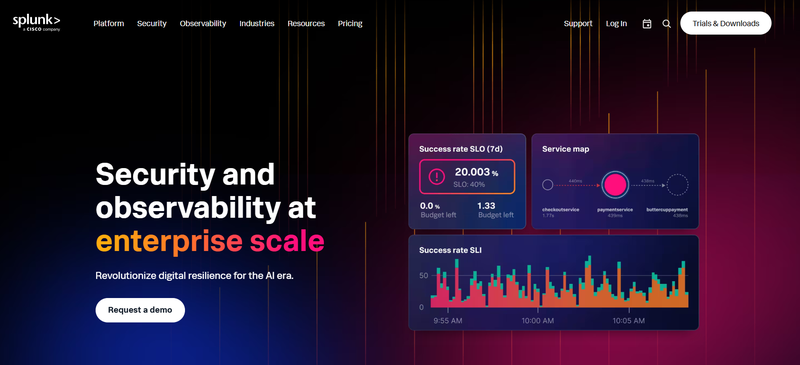
Best for: Enterprise operations teams with existing Splunk investments that need unified security and observability alerting
Overview
Splunk Observability Cloud provides full-fidelity distributed tracing (no sampling) and deep integration with Splunk's SIEM and log analytics. For SOC and SRE teams that need to correlate security events with performance data, this integration is unmatched. Separate product from Splunk Enterprise with separate pricing.
Operational Highlights
- Full-fidelity traces - no sampling means no blind spots during high-cardinality investigations
- AI-based alerting with noise reduction
- Deep Splunk SIEM integration - security and ops in one workflow
- Real-time stream processing
- Strong enterprise compliance story
Pricing
$15/host/month base for infrastructure. APM and logs priced via enterprise contract.
At 30TB/month: ~$35,000-$60,000+/month
Pros
- Full-fidelity traces - no blind spots during complex investigations
- Best security + observability integration for unified SOC/SRE workflows
- AI alerting with built-in noise reduction
Cons
- Most expensive option - hard to justify without existing Splunk investment
- Significant deployment and configuration effort
- Heavy vendor lock-in
- Value proposition is primarily for Splunk-native organizations
Cost Comparison at 30TB/Month Ingestion
| Tool | Est. Cost @ 30TB/mo | Pricing Model | OTel Native | Data Residency | Self-Hosted |
|---|---|---|---|---|---|
| CubeAPM | ~$5,100/mo all-in($4,500 license +$600 infra) | $0.15/GB flat | ✓ Native | ✓ Always | ✓ Yes |
| Elastic APM | ~$8K-$15K (cloud) | Deployment-based | ✓ Partial | ✓ If self-hosted | ✓ Yes |
| Grafana Cloud | ~$15K-$20K+ | Usage-based | ✓ Native | ✓ If self-hosted | ✓ Yes |
| New Relic | ~$20K-$25K+ | Ingest + per-user | Partial | ✗ SaaS only | ✗ No |
| Dynatrace | ~$20K-$35K+ | GiB-hour + commit | Partial | ✓ Managed option | ✓ Managed |
| Datadog | ~$30K-$45K+ | Host + feature-based | Partial* | ✗ SaaS only | ✗ No |
| Splunk | ~$35K-$60K+ | Host + enterprise | Partial | Limited | Limited |
* OTel metrics in Datadog are often billed as custom metrics. All estimates use the reference scenario above. Vendor discounts can significantly reduce SaaS costs.
How to Choose
Choose CubeAPM if you want full-stack observability that stays up when external services don't, with pricing you never have to think about. Flat $0.15/GB means incident investigation is never a budget event.
Choose Datadog if you need the broadest integration coverage and the most polished operational UI. Be prepared to manage billing complexity as a trade-off.
Choose Dynatrace if automated root cause analysis matters more than anything else. Davis AI is the best in class for reducing MTTR in complex microservice environments.
Choose New Relic if you're a smaller team that values NRQL's flexibility for ad-hoc investigation and wants a free tier to start.
Choose Grafana Cloud if your team already lives in Grafana and wants to extend it to full observability with maximum dashboard customization.
Choose Elastic APM if you already run ELK and want logs + traces in one Kibana interface without adding another vendor.
Choose Splunk if you need unified security and observability in one platform and already have the Splunk investment to justify the cost.
Final Thoughts
The best APM tool is the one your on-call engineers actually trust to tell them what's broken and why. Integration breadth, AI features, and pricing models all matter - but they matter in service of that core outcome.
The practical reality in 2026 is that the operational gap between the incumbents and newer self-hosted platforms has narrowed considerably, while the cost gap has widened. For teams where observability spending has become a recurring conversation with finance, the 6-12x price difference between self-hosted alternatives and enterprise SaaS is worth a proof-of-concept. For teams where the incumbents are working well and the budget isn't a concern, there's no reason to switch for the sake of switching.
Either way, the decision deserves a real evaluation - not a default renewal.

Safeguard Your Child Against Online Threat
Register Now

